Jul 27, 2016
OMS Summer School 2016
In the summer course we have conducted from 18-21 July, 2016, there are plenty of resources presented on the way our research team here in Trento is modelling hydrology. The blog Abouthydrology detailed it, and here I shared for any way interested in the OMS modelling framework. Here you can go to the link AboutHydrology: OMS Summer School 2016 - What we actually did: This is what we actually did at the Summer School on OMS3. Here you will find slides and material (actually, it is already presented in the ...

Jul 1, 2016
Water Budget of the upper Blue Nile basin
If we, as a hydrologic science community, are aims to contribute for understanding and managing the water resource, it is important to provide space-time information for all the components of water cycle i.e precipitation, evapotranspiration, runoff, and storage together. Usually such estimation is persuaded at annual time scale for large basin using the budyko hypothesis. However, this kind of estimation is not useful for operational purpose as hydrological information at daily and weekly scale is a key for agricultural application. Here, a paper submitted for HESSD, is our effort to estimate space-time distributed water budget for the Upper Blue Nile basin, an exemplary for data scarce and large scale problems.


May 23, 2016
The "details lost" rainfall information in hydrological modelling
I have been interested to this topic since two years ago, and I realised now I will not find time to do it . So let me put my thought here.
The spatial rainfall variability is well recognised field of study and it is also the one that needs further improvement in hydrology (Syed et al., 2003, Woolhiser, 1996). In the proper estimation of spatial rainfall data for modelling, there are efforts on the characterisation of rainfall field at different scale. In the context of semi-distributed hydrological models, the rainfall inputs are usually required at some level of aggregated (i.e sub basin, HRU, hillslope). All the efforts of rainfall estimation and their spatial variability is focused mainly in the correct estimation of the 1st moment of these hydrological modelling units. Bloschl and Sivapalan (1995) formalised the upscaling activities as two steps: distributing the point measurement to the large area (units), and aggregation of spatially distributed rainfall into a single value. In the series of papers, Foufoula-Georgiou and her co-authors (Kumar and Foufoula-Georgiou, 1990, Foufoula-Georgiou and Lettenmaier, 1986, Foufoula-Georgiou and Georgakakos, 1991, Kumar and Foufoula-Georgiou, 1993b,a), in effort to understand this rainfall spatial organisation at die rent scales, they point out that spatial rainfall characterisation at larger scale provides average (smoothed process) and the "detail lost" information. While the smoothed process is representation of the areal mean rainfall at the sub basin scale, the "detail lost" is the rainfall information that is lost during the smoothing processes, which can be inferred from other statistical moments.
It is note that in the semi-distributed model, the modelling units are based on the "hydrological similarity concepts". This mean that the units (subbasin) are statistically characterized. So far all the studies on semi-distributed models, or those uses large scale grid inputs, focused on the proper representation of the 1st statistical moment, and as to my experience, there is gaps in understanding and incorporating the sub basin variability in to the modelling environments.
With all research eorts in understanding the spatial representation of rainfall at all level of scales, however, it is clearly apparent that the effort to incorporate the rainfall spatial variability in the semi-distributed modelling solution is missed. The epistemic sources of uncertainty, i.e, uncertainty caused by the system representation and lack of skills to treat them, in hydrological model are the one we need to be concerned (Beven et al. 2011; Merz and Thieken, 2005).
What I think important is the use of probability distribution of rainfall at each time steps for each HRU(hydro logical response units) to obtain the probably of discharge time series instead of a single deterministic estimation. I have seen the use of various models to incorporate the model parameters to generate the probability band of simulation, but never seen due to the use of forcing input data. Here this figure is to show the effects of the mean (centre), the maximum and minimum (the blue band) of rainfall of each HRU of a basin in JGrass-NewAge modelling.
 Fig 1: JGrass-NewAge simulation using different HRU rainfall representation.
References
Keith Beven, PJ Smith, and Andrew Wood. On the colour and spin of epistemic error (and what we might do about it). Hydrology and Earth System Sciences, 15(10):3123
Gunter Bloschl and M Sivapalan. Scale issues in hydrological modelling: a review. Hydrological processes, 9(3-4):251{290, 1995.
E Foufoula-Georgiou and Konstantine P Georgakakos. Hydrologic advances in space-time precipitation modelling and forecasting. In Recent advances in the modelling of hydrologic systems, pages 47{65. Springer, 1991.
E Foufoula-Georgiou and Dennis P Lettenmaier. Continuous-time versus discrete-time point process models for rainfall occurrence series. Water Resources Research, 22(4):531
Praveen Kumar and E Foufoula-Georgiou. Fourier domain shape analysis methods: A brief review and an illustrative application to rainfall area evolution. Water Resources Research, 26(9):2219
Praveen Kumar and E Foufoula-Georgiou. A multicomponent decomposition of spatial rainfall elds: 2. self-similarity in fluctuations. Water Resources Research, 29(8):2533{2544, 1993a.
Praveen Kumar and E Foufoula-Georgiou. A new look at rainfall fluctuations and scaling properties of spatial rainfall using orthogonal wavelets. Journal of Applied Meteorology, 32(2):209
Bruno Merz and Annegret H Thieken. Separating natural and epistemic uncertainty in food frequency
analysis. Journal of Hydrology, 309(1):114
Kamran H Syed, David C Goodrich, Donald E Myers, and Soroosh Sorooshian. Spatial characteristics of thunderstorm rainfall elds and their relation to runo. Journal of Hydrology, 271(1):1{21, 2003.
The spatial rainfall variability is well recognised field of study and it is also the one that needs further improvement in hydrology (Syed et al., 2003, Woolhiser, 1996). In the proper estimation of spatial rainfall data for modelling, there are efforts on the characterisation of rainfall field at different scale. In the context of semi-distributed hydrological models, the rainfall inputs are usually required at some level of aggregated (i.e sub basin, HRU, hillslope). All the efforts of rainfall estimation and their spatial variability is focused mainly in the correct estimation of the 1st moment of these hydrological modelling units. Bloschl and Sivapalan (1995) formalised the upscaling activities as two steps: distributing the point measurement to the large area (units), and aggregation of spatially distributed rainfall into a single value. In the series of papers, Foufoula-Georgiou and her co-authors (Kumar and Foufoula-Georgiou, 1990, Foufoula-Georgiou and Lettenmaier, 1986, Foufoula-Georgiou and Georgakakos, 1991, Kumar and Foufoula-Georgiou, 1993b,a), in effort to understand this rainfall spatial organisation at die rent scales, they point out that spatial rainfall characterisation at larger scale provides average (smoothed process) and the "detail lost" information. While the smoothed process is representation of the areal mean rainfall at the sub basin scale, the "detail lost" is the rainfall information that is lost during the smoothing processes, which can be inferred from other statistical moments.
It is note that in the semi-distributed model, the modelling units are based on the "hydrological similarity concepts". This mean that the units (subbasin) are statistically characterized. So far all the studies on semi-distributed models, or those uses large scale grid inputs, focused on the proper representation of the 1st statistical moment, and as to my experience, there is gaps in understanding and incorporating the sub basin variability in to the modelling environments.
With all research eorts in understanding the spatial representation of rainfall at all level of scales, however, it is clearly apparent that the effort to incorporate the rainfall spatial variability in the semi-distributed modelling solution is missed. The epistemic sources of uncertainty, i.e, uncertainty caused by the system representation and lack of skills to treat them, in hydrological model are the one we need to be concerned (Beven et al. 2011; Merz and Thieken, 2005).
What I think important is the use of probability distribution of rainfall at each time steps for each HRU(hydro logical response units) to obtain the probably of discharge time series instead of a single deterministic estimation. I have seen the use of various models to incorporate the model parameters to generate the probability band of simulation, but never seen due to the use of forcing input data. Here this figure is to show the effects of the mean (centre), the maximum and minimum (the blue band) of rainfall of each HRU of a basin in JGrass-NewAge modelling.

Fig 1: JGrass-NewAge simulation using different HRU rainfall representation.
On the total freshwater storage deficit of Ethiopia
As it receives one of the highest rainfall amount in the continent and the region, Ethiopia is the water tower for the greater horn of Africa and the Nile. Because of its small-holder and traditional based agrarian economy, but recurrent drought is the main development challenge. In the last decades, hydrologists developed many drought indexes based on various hydrological and meteorological components like rainfall, evapotranspiration, and runoff to provide indexes for decision making. some of these are: Drought Severity Index (PDSI) (Palmer, 1965), Crop Moisture Index (CMI) (Palmer, 1968), Standardized Precipitation Index (SPI) (McKee et al., 1993), and Surface Water Supply Index (SWSI) (Shafer and Dezman, 1982). There are already some efforts to understand the pattern of rainfall in the region, mainly from the long term climate change perspective, and the findings are mixed.
The total available freshwater is the residual of all the hydrological fluxes. Hence, it is the integrated indicator of the water budget system of a basin. On the contrary, it is the most difficult component to measure, if obtained with huge efforts, it is very specific and point information. NASA’s Gravity Recovery and Climate Experiment (GRACE) mission (Tapley et al., 2004) provides an independent satellite observation of change of the total water storage. Recently this data has been used to estimate the total water deficit of large basin, and it is evaluated positively. Here, I analyzed GRACE data to understand the total water storage of the Ethiopia. The objectives are:1. to estimate the long term water storage mean at monthly time steps; 2. to estimate the total water deficit of each months ("drought event" if longer than the months ); 3. to calculate the total water status according to the GRACE observation for the last one decade.Here are some results, and hoping to detail the methodology and extend the results in the near future.
 |
Fig 1: The long term mean monthly total water storage distribution of Ethiopia according to GRACE observation.

Fig 2: the long term monthly mean storage deficit maps of Ethiopia as observed from GRACE

Fig: Time series storage deficit (below zero ) at national level . At national scale, the water storage over the long term trend is more or less at constant level

Fig 4: the time series storage deficit at four location in the country
To be continued…..
References
Palmer, W.C. Meteorological Drought; U.S. Department of Commerce, Weather Bureau: Washington, DC, USA, 1965.
Shafer, B.A.; Dezman, L. Development of a Surface Water Supply Index (SWSI) to assess the severity of drought conditions in snowpack runoff Areas. In Proceedings of the Western Snow Conference, Reno, NV, USA, 19–23 April 1982.
McKee, T.B., Doesken, N.J., Kleist, J., 1993. The relationship of drought frequency and duration to time scales. In: Proceedings of the 8th Conference on Applied Climatology, American Meteorological Society, Anaheim, CA, Boston, MA, 17–22 January, pp. 179–184.
Tapley, B. D., S. Bettadpur, J. C. Ries, P. F. Thompson, and M. M. Watkins (2004), GRACE measurements of mass variability in the Earth system, Science, 305(5683), 503–505, doi:10.1126/science.1099192.
May 2, 2016
AboutHydrology: Wuletawu's Abera Ph.D. defense
AboutHydrology: Wuletawu's Abera Ph.D. defense: This illustrate the long and detailed work of Wuletawu Abera during his Ph.D. His topic was modelling the whole hydrological cycle, meaning...
Apr 10, 2016
Cloud Cover on the surface net radiation
Solar radiation is the key driving force for water cycle. It modulates how much water land surface evaporates and plant transpires. The explicitly estimation of radiation is essential for water budget modelling. One of the major factor affect the net surface radiation is the cloud cover. It can affect the net radiation in many ways. The influence of cloud on the land surface energy depends on several factors, such as cloud altitude, it size, the nature of the cloud particles.
Due to the lack of accurate cloud cover information, the net radiation modelling thereby the processes of land-atmosphere interaction is poorly characterised. Some spatial cloud cover data, as given by recent satellite imagery, however, can contribute for better estimation of the basin water budget simulation. For effort in this direction, EUMETSAT Climate Monitoring Satellite Application Facility (CM SAF) cloud cover fraction data can be useful resource. Here I have processed this data for Upper Blue Nile basin to be used in water budget modelling. A sample of the monthly mean could cover map over the basin for the 1994 is shows in figure 1.

The seasonality of the cover can be clearly seen, and this contributes to the reason for governing factors of the seasonality in the basin water budget.
Frank Richards and Phil Arkin
J. A. Griggs and J. L. Bamber
Due to the lack of accurate cloud cover information, the net radiation modelling thereby the processes of land-atmosphere interaction is poorly characterised. Some spatial cloud cover data, as given by recent satellite imagery, however, can contribute for better estimation of the basin water budget simulation. For effort in this direction, EUMETSAT Climate Monitoring Satellite Application Facility (CM SAF) cloud cover fraction data can be useful resource. Here I have processed this data for Upper Blue Nile basin to be used in water budget modelling. A sample of the monthly mean could cover map over the basin for the 1994 is shows in figure 1.

The seasonality of the cover can be clearly seen, and this contributes to the reason for governing factors of the seasonality in the basin water budget.
Some papers on cloud and hydrology
Cawkwell, F. G. L., and J. L. Bamber. "The impact of cloud cover on the net radiation budget of the Greenland ice sheet." Annals of Glaciology 34.1 (2002): 141-149.
Alados, I., et al. "Relationship between net radiation and solar radiation for semi-arid shrub-land." Agricultural and Forest Meteorology 116.3 (2003): 221-227.
to be updated….
Apr 2, 2016
PhD thesis is submitted….
Last week I submitted my PhD thesis, and my final defense is schedule on April 28, 2016. Th title of thesis is "Modelling water budget at a basin scale using JGrass-NewAge system". It contains about eight chapters, where the first and the last chapters are the introduction and the concluding synthesis of the issues being discussed. I will take time, after the defense, to summarise the results of the research. Here, instead I would like to pass my gratitude to all individuals who helped me through the last four years. The acknowledgement of the thesis is given as follows:

Here I am at the end of my PhD journey. To pass the ups and downs of life in general and the PhD journey in particular, there has been many people helping me directly and indirectly. Before and above all, GOD is always my mainstay.
First and foremost I would like to thank my supervisor, Professor Riccardo Rigon, for all his ideas, discussions, support, criticism, and thorough review of my works. His technical skills to solve problems at hand and long term envision and outlook for the subject of hydrology is exceptional. I also would like to thank him for demanding better research results; for challenging my decisions; and for providing me funds to cover part of my PhD studies and attend conferences, seminars and summer schools. These supports, both the financial and intellectual, contributes to my academic growth as a hydrologist. Prof, thank you for all!
I am indebted to Professor Marco Borga of Padova University for his support by providing me data, having comments and discussion on my works. He was also my MSc thesis supervisor, and the first person to introduce me to the subject of hydrology.
My colleague and friend Dr. Giuseppe Formetta helped me a lot with the source codes and practicalities of JGrass-NewAge model system. The success of this PhD work is also comes from his immense support in the codes and informatics point of view. Thanks Giuseppe!. I am sincerely thankful to my research group members, Marialaura Bancheri and Francesco Serafin.
I would like to extend my heartfelt gratitude to Dr. Luca Brocca (Research Institute for Geo-Hydrological Protection, National Research Council, Italy) for his support for providing me data, for the discussion we have and the corrections he made on my work.
I am grateful to National Meteorological Agency (NMA) of Ethiopia, Ministry ofWater Resources (MOWR) of Ethiopia, and University of Reading for providing me meteorological, discharge and TAMSAT satellite rainfall data for Upper Blue Nile basin respectively.
I would like to extend my gratitude to all academic and administrative staffs of the Department of Civil, Environmental, and Mechanical Engineering of Trento university. The Department of Geography and Environmental studies of Mekelle University is always kind to me, and thankful for granting me a study leave.
I would like to thank my father, Abera Worku, and my mother, Taytu Mohamed, who grew me up in the best possible way they can. I am who I am now is because they nurtured and educated me all the way. Mommy and Daddy, you are the source of my happiness. I wish you long live!
Most importantly, I would like to thank my wife, Muluadam Teshome for her love and support. Her encouragement, love and care during difficult time has been my source of strength. I love you so much, sweetheart!
Finally, to all my friend, you know who you are, and others who I have not mentioned, but who have helped, contributed, encouraged or even discouraged, I tried to learn something from you as much as I can. Thank you!
This work is dedicated to the farmers of Ethiopia who suffers from recurrent deadly droughts and poor water resource governance.

Mar 1, 2016
Nile is flowing out from the Upper Blue Nile basin
Nile is flowing out from the Upper Blue Nile basin, I mean, here at my blog. We have been working on the Upper Blue Nile basin to estimate each term of the water budget at various time scale and temporal scale. Discharge needs to be modelled at each channel links and can be verified at links where there is observation data. The discharge for the summer 1994 is shown in the following animation. The daily discharge from May - Sept 1994 of each channels of Upper Blue Nile basin was like this, as we estimated!
 |
| Fig: discharge at each channel link for each day from May 01 to Sept 31, 1994 |
Feb 21, 2016
Comparison of different satellite rainfall data
We have done a comparison study on different satellite rainfall data in Upper Blue Nile, you can find it here. Here narrowing the choice of products to three, based on their performances, the long term (2002-2012) mean daily spatial distribution, is depicted in figure 1.
And, similarly, the long term mean annual comparison is shown in figure 2.
Note on spatial pattern of the rainfall and the difference between these products. I will come back another time for detail discussion on this.
 |
| fig1: the long term mean daily rainfall data in UBN basin |
 |
| fig 2: The long term annual mean rainfall of UBN basin. |
Dec 26, 2015
GRACE for total water storage estimation
GRACE is a remote sensing of water storage based on gravity field. The two twin NASA's Gravity Recovery and Climate Experiment (GRACE) mission detect the gravitational field of the Earth surface. Since the effect of land mass (or large body) in the change of gravitational field is small, and slow, the main change is due to the change in water mass. The terrestrial water has a mass, and always in motion. So measuring the time varying gravitational field is measuring the total water storage of the earth. This gives the hydrologist unprecedented chance to see and understand how much they are able to close the water budget modelling. Since the total water storage (TWS) is the main sources of water for use, and it the aggregated values of the water fluxes, the GRACE data will help the water resource managers and policy planners to be very proactive.
Recently, I have been starting to explore this dataset if it is possible to use in basin hydrological modelling. While I will come back to the results of the study in the future, here is the GRACE map of Ethiopia for some years (2002-2008) at monthly time steps. I presented the map in animation below. It is estimated at zonal level. Note that the unit is cm.
 |
Nov 25, 2015
"Poverty reduction in Ethiopia in the last decade have been closely associated with unusually reliable rainfall"
Last week in Addis Ababa EGU conference, I met Professor Simon Dadson who is the co-investigator of this new and large (from 2015-2022) project called REACH . The project is funded by the UK government and hosted by oxford university school of Geography and the Environment, aiming to conduct water security and poverty issues in three countries: Kenya, Ethiopia and Bangladesh. This is really the beginning of interesting effort, and I hope it will accrue wealth of knowledge and understanding on the clear relationship between water resources availability (security) and level of poverty.
While I will follow their efforts and works closely in this regards, at the moment, browsing the project website I have seen this interesting statement "Major reductions in poverty [in Ethiopia] in the last decade have been closely associated with unusually reliable rainfall". It is true that small land-hold rain-fed agriculture farmer in Ethiopia depends mainly on nature of rainfall. However, I never noticed this contribution to the recent 'poverty reduction' process. In fact the climatological drought we have this year due to El Nino is highly (directly) contributing to agricultural drought and famine.
Understanding the rainfall patterns, or be able to forecast it, and estimation of its effect on hydrological and agricultural drought is crucial step. If possible, hydrological forecasting for future short time such as for one/two week(s) would really be very interesting challenge that I would like to do in my academic career life!

Nov 24, 2015
EGU Topical conference
This year, three important meetings of water science jointly organised at Addis Ababa, from November 18-20, 2015. The three meetings are the Alexander von Humboldt Conference of the European Geosciences Union, the STAHY workshop of the International Commission on Statistical Hydrology of the International Association of Hydrological Sciences (ICSH-IAHS) and the Leonardo Conference of the Hydrological Sciences Division of the European Geosciences Union. While there were a lot of good presentation, the following three presentations were more interesting topics of basin water balance modelling in general and our (my) approach of doing water balance estimation in particular.
- Towards Optimization of Reservoir Operations for Hydropower Production in East Africa: Seasonal Climate Forecasts (Leonardo Lecture) --- by Mekonnen Gebremichael. Abstract
- Education and TAHMO, the Trans-African Hydro-Meteorological Observatory --- by Nick van de Giesen. Abstract
- How important are soils for hydrological modelling? --- by Hubert H.G. Savenije. Abstrac
- characterisation of the regional variability of seasonal water balances within the Omo-Gibe River basin --- by Adanech Yared Jillo
Oct 9, 2015
List of Hydrologist working in Ethiopia and horn of Africa
Hydrologists all over the world, I mean those who are real and good ones, are peoples fighting with nature to understand better how nature (hydrological cycle works, and are those providing and accumulating hydrological information. So having any good hydrologist at any corner of the world is obviously mean better awareness and insight how the terrestrial water cycle.
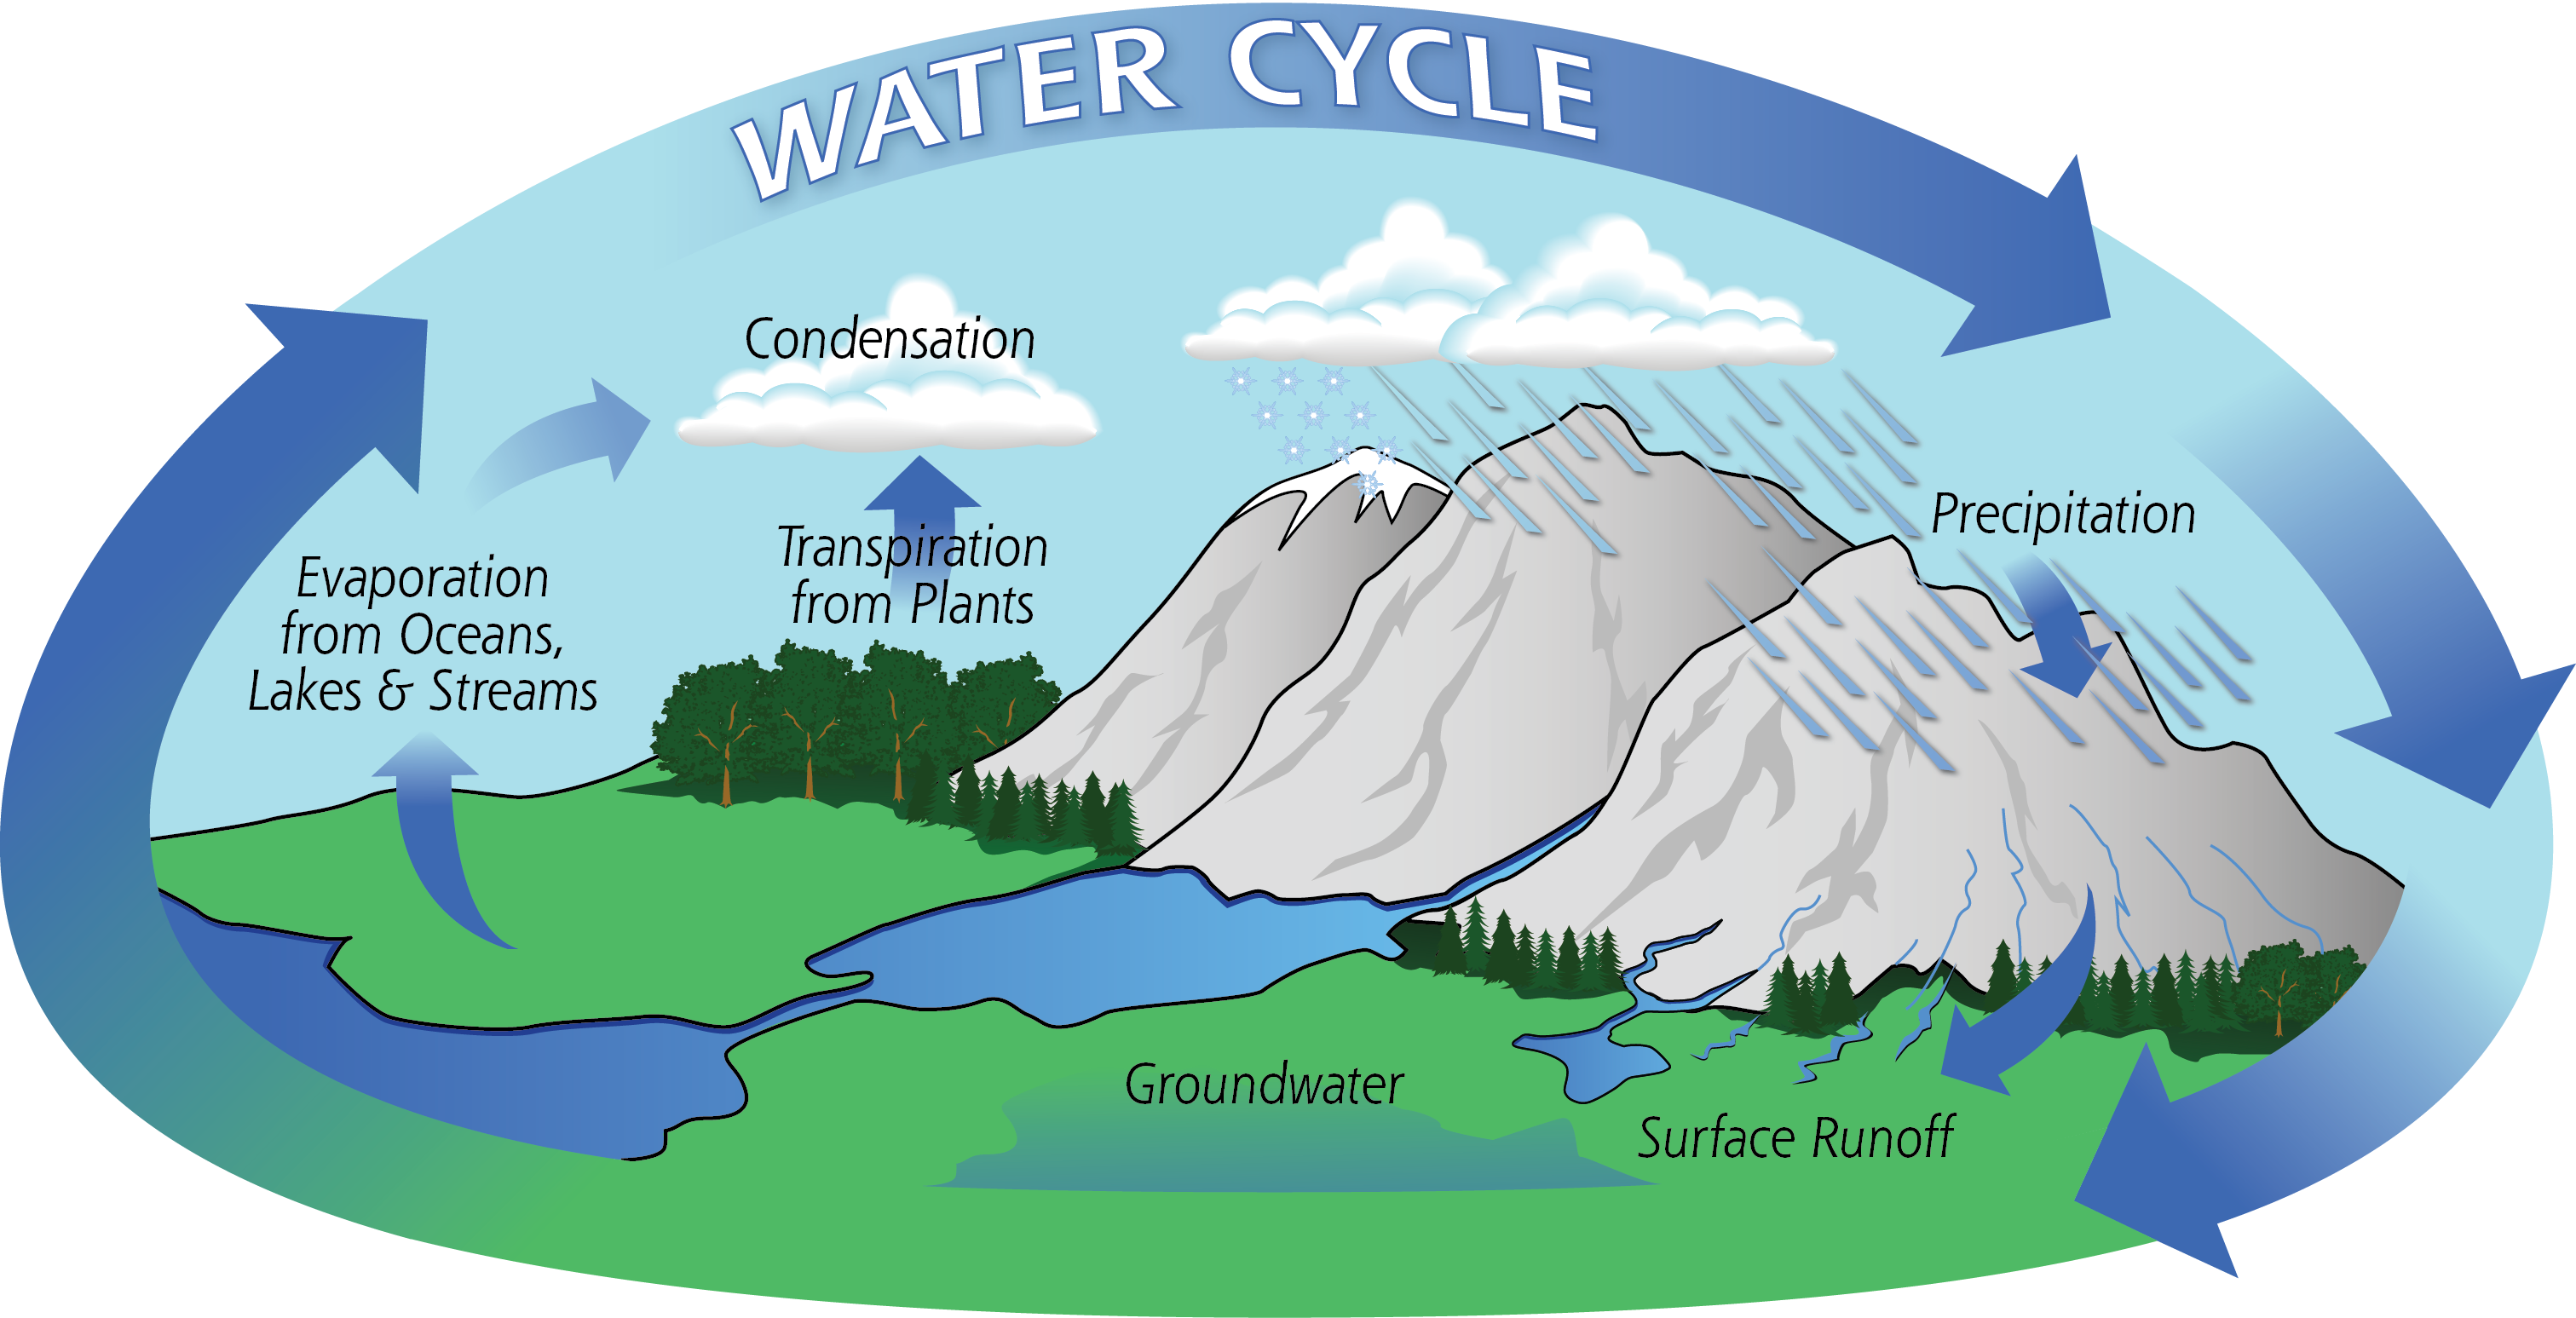
However, when it comes to solve a particular water related problems in a particular area, those who did researches in that regions are better understand the problems and provides "quantitative" information. More over, every basin is hydrologically unique!
Ethiopia is hydrologically complex country with many water related problems. Having a personal goal to deal with the water related problems and particularly agricultural water resources in Ethiopia, I am interested to talk, to discuss and collaborate, or even to follow and read their research outputs. So here is an updating list of hydrologist that works in Ethiopia and surrounding regions. The list will be those of pure hydrologist, in the sense that I will not include other related scientists. And I don't pretend that I will find all hydrologist working in that regions. It can also be used as list to organise workshop and conference in the region. Anyway some of hydrologist working in the region are:
- Assefa M. Melesse (GS)
- Declan Conway (GS)
- ALEMSEGED TAMIRU HAILE (IWMI)
- Simon Langan (RG)
- Tammo S Steenhuis (CU)
- Shimelis Gebriye Setegn (GS)
- Seifu A Tilahun (GS)
- Senay Gabriel (SDSU)
- Paul J. Block (CV)
- Tom Rientjes(GS)
- Mekonnen Gebremichael (UCONN)
- Seifu Kebede (RG)
- Tenalem Ayenew (RG)
- Dagnachew Legesse (RG)
- Amy S. Collick (RG)
- Semu Moges (RG)
- Tena Alamirew (linkedin)
- Meron Teferi Taye (GS)
- Menberu Meles Bitew (GS)
To be updated …….
Oct 7, 2015
Sep 22, 2015
satellite rainfall estimation products in Upper Blue Nile Basin
This is stub for the complimentary material for our paper: Comparative evaluation of satellite rainfall estimation products and bias correction in Upper Blue Nile Basin. I will provide the data, R scripts and some supplementary results soon....

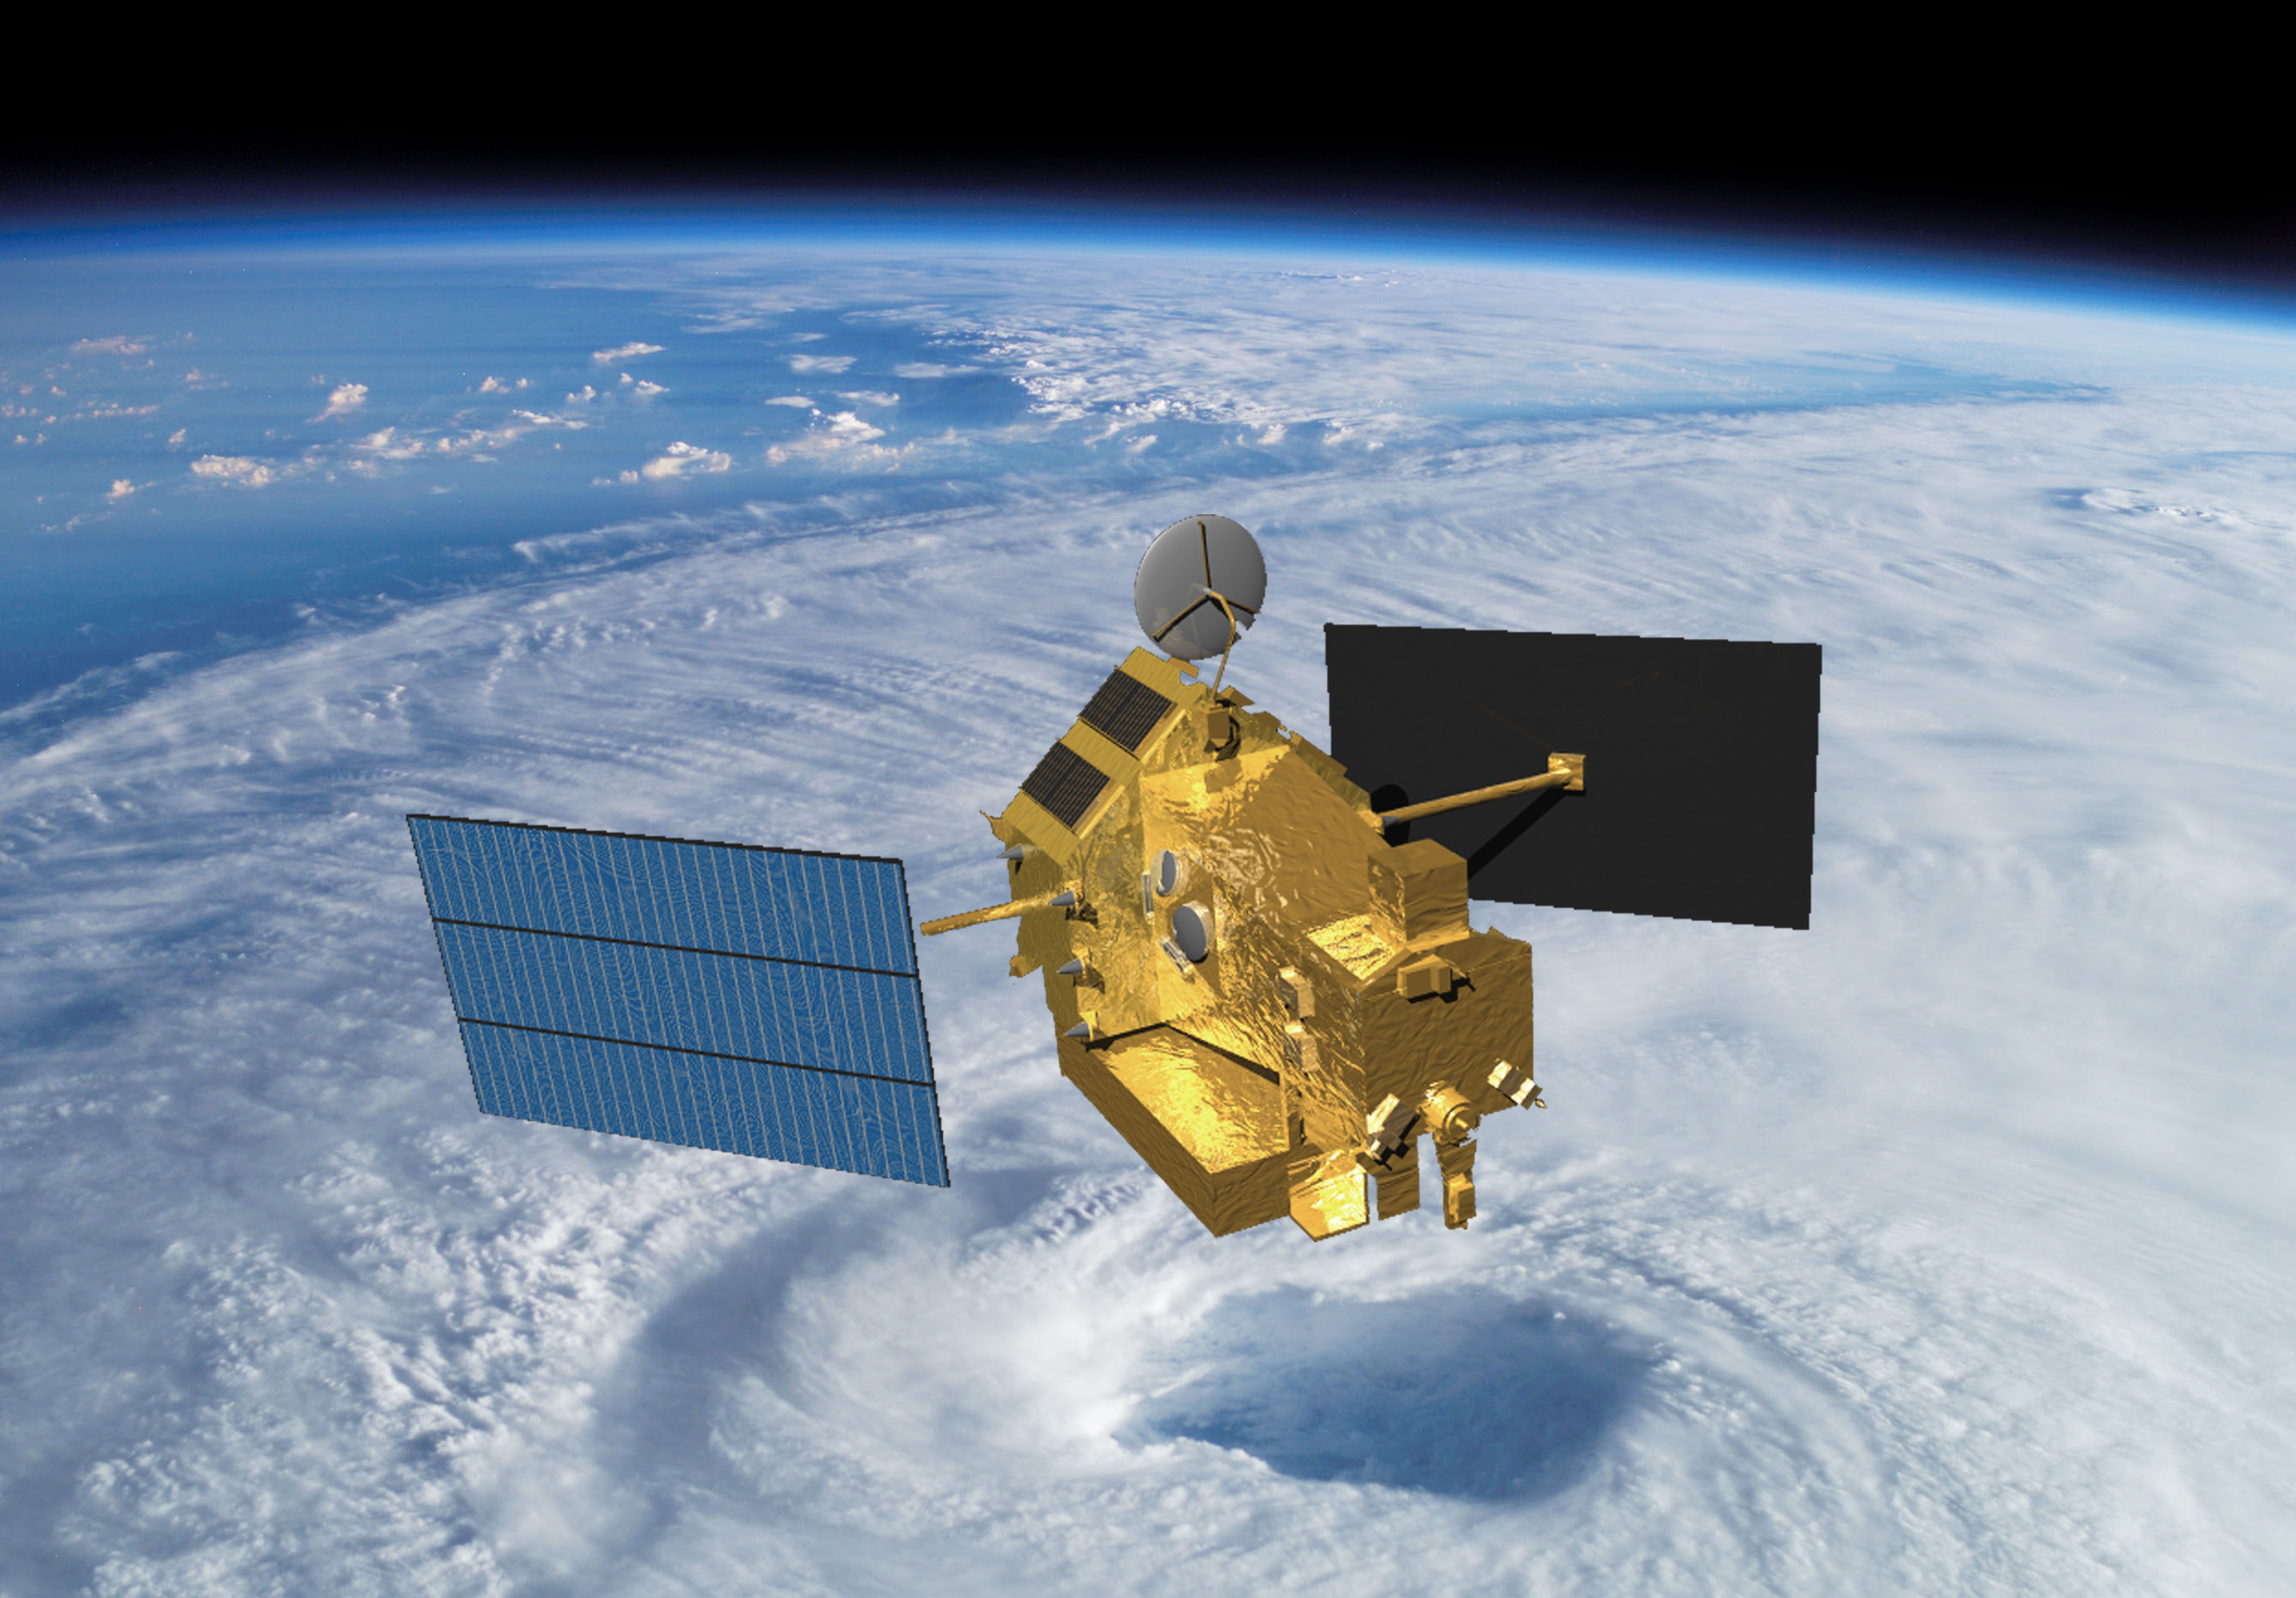
- The Satellite rainfall dataset
- The ground-gauge dataset
- The DEM
- R scripts
Sep 18, 2015
The small, the large, and the macro hydrological system
The global hydrological cycle is a closed system, meaning that the amount of water is fixed. No input, no output. It is just the circulation! Every river basin takes the amount of water it needs for its ecosystem maintenance and return it back to the global hydrological system. For a river system, the input to the basin is precipitation whereas the outputs are the amount of water that the basin return it back to the system. These are the discharge ( river flow), and evapotranspiration driven by the energy balance. As the system changed from the closed system to the open system as moving to the global cycle to basin water cycle, the basin scale at which the hydrological cycle is looked at matters. This mean that the proportion of the components such as the precipitation, discharge, evapotranspiration, storage varies across scale.
The first procedure in modelling the hydrological system is the geometry at which the cycle is estimated. This geometry is extracted from the digital elevation models. These days, they can be easily available from different sources. Based on the objective and purpose of the modelling, the spatial scale of the basin can be ranged from few kilometres to hundreds of kilometres (or continental scale). The digital watershed modelling (DWM) is the pre requisite for modelling, for instance, we are interested at different scales, and we have been working in the following:
- Posina Bain, small scale basin
- Adige scale, large scale basin
- Upper Blue Nile basin, Macro scale
2. Adige river basin
I will not talk about Posina basin in this post. I will have other post about small basin DWM, and hydrological modelling space-time variability. Adige is one of the largest, the second largest basin in Italy(?). It provides water resources to all the Bolzano, Trentino and Veneto region. We have interest to model water resource at this basin, and the first step is the DWM. It is possible to start from the whole basin, and look it into the detail. To work on the maximum detail topographic information, following series of steps as described in other post, DEM need to be partitioned into many detail, for instance, here the Adige is divided into about 1200 HRUs.
 |
| Adige basin partion into 1200 HRUs using JGrass Spatial toolbox |
However, such large numbers of HRUs could computationally be demanding and difficult for data management, particularly if we are interested to the hydrological outputs at each HRUs. For this reason, the basin can be separated into major basin, and the simulation can be take care of at each particular basin, and use some routing system to estimate at the furthest outlet of the whole basin. For instance, Adige basin can be divided into several basin (notice the black divides inside the basin, in to five major basin), and then hydrological simulation can be carried out at each basin, and some sort of routing mechanism can be applied to route to the outlet.


Some of these can be:
  |
The position of Adige-Passirio basin (right) and the topography partitioning into HRU


Isarco basin (relatively small basin) that can be singled out for simulation purpose


Rienza basin and its topographic partitioning

 |
Avisio basin and its partition

 |
3. Upper Blue Nile basin
What we have to do if we are interested even larger (very larger ) basin than the Adige ??? For instance Upper Blue Nile basin, the Ethiopia part of the Blue Nile? Let's start from what people already did:

Lake Tana basin where most hydrological studies in the UBN basin is conducted
- e.g Alemseged T. Haile, Tom Rientjes, Ambro Gieske, and Mekonnen Gebremichael, 2009: Rainfall Variability over Mountainous and Adjacent Lake Areas: The Case of Lake Tana Basin at the Source of the Blue Nile River. J. Appl. Meteor. Climatol., 48, 1696–1717. doi: http://dx.doi.org/10.1175/2009JAMC2092.

Senay, G. B., Asante, K. and Artan, G. (2009), Water balance dynamics in the Nile Basin. Hydrol. Process., 23: 3675–3681. doi: 10.1002/hyp.7364
At this study of water balance at the whole Nile basin, UBN is used as single basin. No space-time variabilities study

Dile et al, also studied water balance at Lake Tana basin ..... as example for UBN basin study
Dile, Yihun Taddele and Raghavan Srinivasan, 2014. Evaluation of CFSR Climate Data for Hydrologic Prediction in Data-Scarce Watersheds: An Application in the Blue Nile River Basin. Journal of the American Water Resources Association (JAWRA) 1-16. DOI: 10.1111/jawr.12182

Gebrehiwot et al, selected 12 basins a way of looking spatial variabilities in water balance temporal dynamics
Gebrehiwot, S., Gardenas, A., Bewket, W., Seibert, J., Ilstedt, U. et al. (2014). The long-term hydrology of East Africa's water tower: statistical change detection in the watersheds of the Abbay Basin.

Tekleab, S., Uhlenbrook, S., Mohamed, Y., Savenije, H. H. G., Temesgen, M., and Wenninger, J.: Water balance modeling of Upper Blue Nile catchments using a top-down approach, Hydrol. Earth Syst. Sci., 15, 2179-2193, doi:10.5194/hess-15-2179-2011, 2011.

" .......a conceptual process-based hydrological model is developed .....to study the runoff mechanisms and rainfall–runoff processes..."
Dessie, M., Verhoest, N. E. C., Pauwels, V. R. N., Admasu, T., Poesen, J., Adgo, E., Deckers, J., and Nyssen, J.: Analyzing runoff processes through conceptual hydrological modeling in the Upper Blue Nile Basin, Ethiopia, Hydrol. Earth Syst. Sci., 18, 5149-5167, doi:10.5194/hess-18-5149-2014, 2014.

ANIL MISHRA & TAKESHI HATA (2006) A grid-based runoff generation and flow routing model for the Upper Blue Nile basin, Hydrological Sciences Journal, 51:2, 191-206, DOI: 10.1623/hysj.51.2.191
This study is grid-based distributed analysis, however, the focus is on runoff production, where evapotranspiration and other component are not explicitly considered.

Kim and Jagath made interesting set-up to model the UBN using 6 sub-basin! However, space-time modelling of UBN using 6 is not something to envisaged ......
Kim, Ungtae and Jagath J. Kaluarachchi, 2009. Climate Change Impacts on Water Resources in the Upper Blue Nile River Basin, Ethiopia. Journal of the American Water Resources Association (JAWRA) 45(6):1361-1378. DOI: 10.1111 ⁄ j.1752-1688.2009.00369.x
Obviously, further space-time hydrological budget characterisation is necessary in UBN basin. In contrast to the maximum subbasin of 6 partition used to study the whole UBN basin, we need to decide some level of partition that really capture the true variability of the rainfall, evapotranspiration, runoff and storage function. 10 ? 20 ? 50 ? 100? 200? 500? For the moment, lets try with 300 HRUs.
 |
| Upper Blue Nile basin discretisation into 300 HRUs |
To be continued........
Subscribe to:
Posts (Atom)