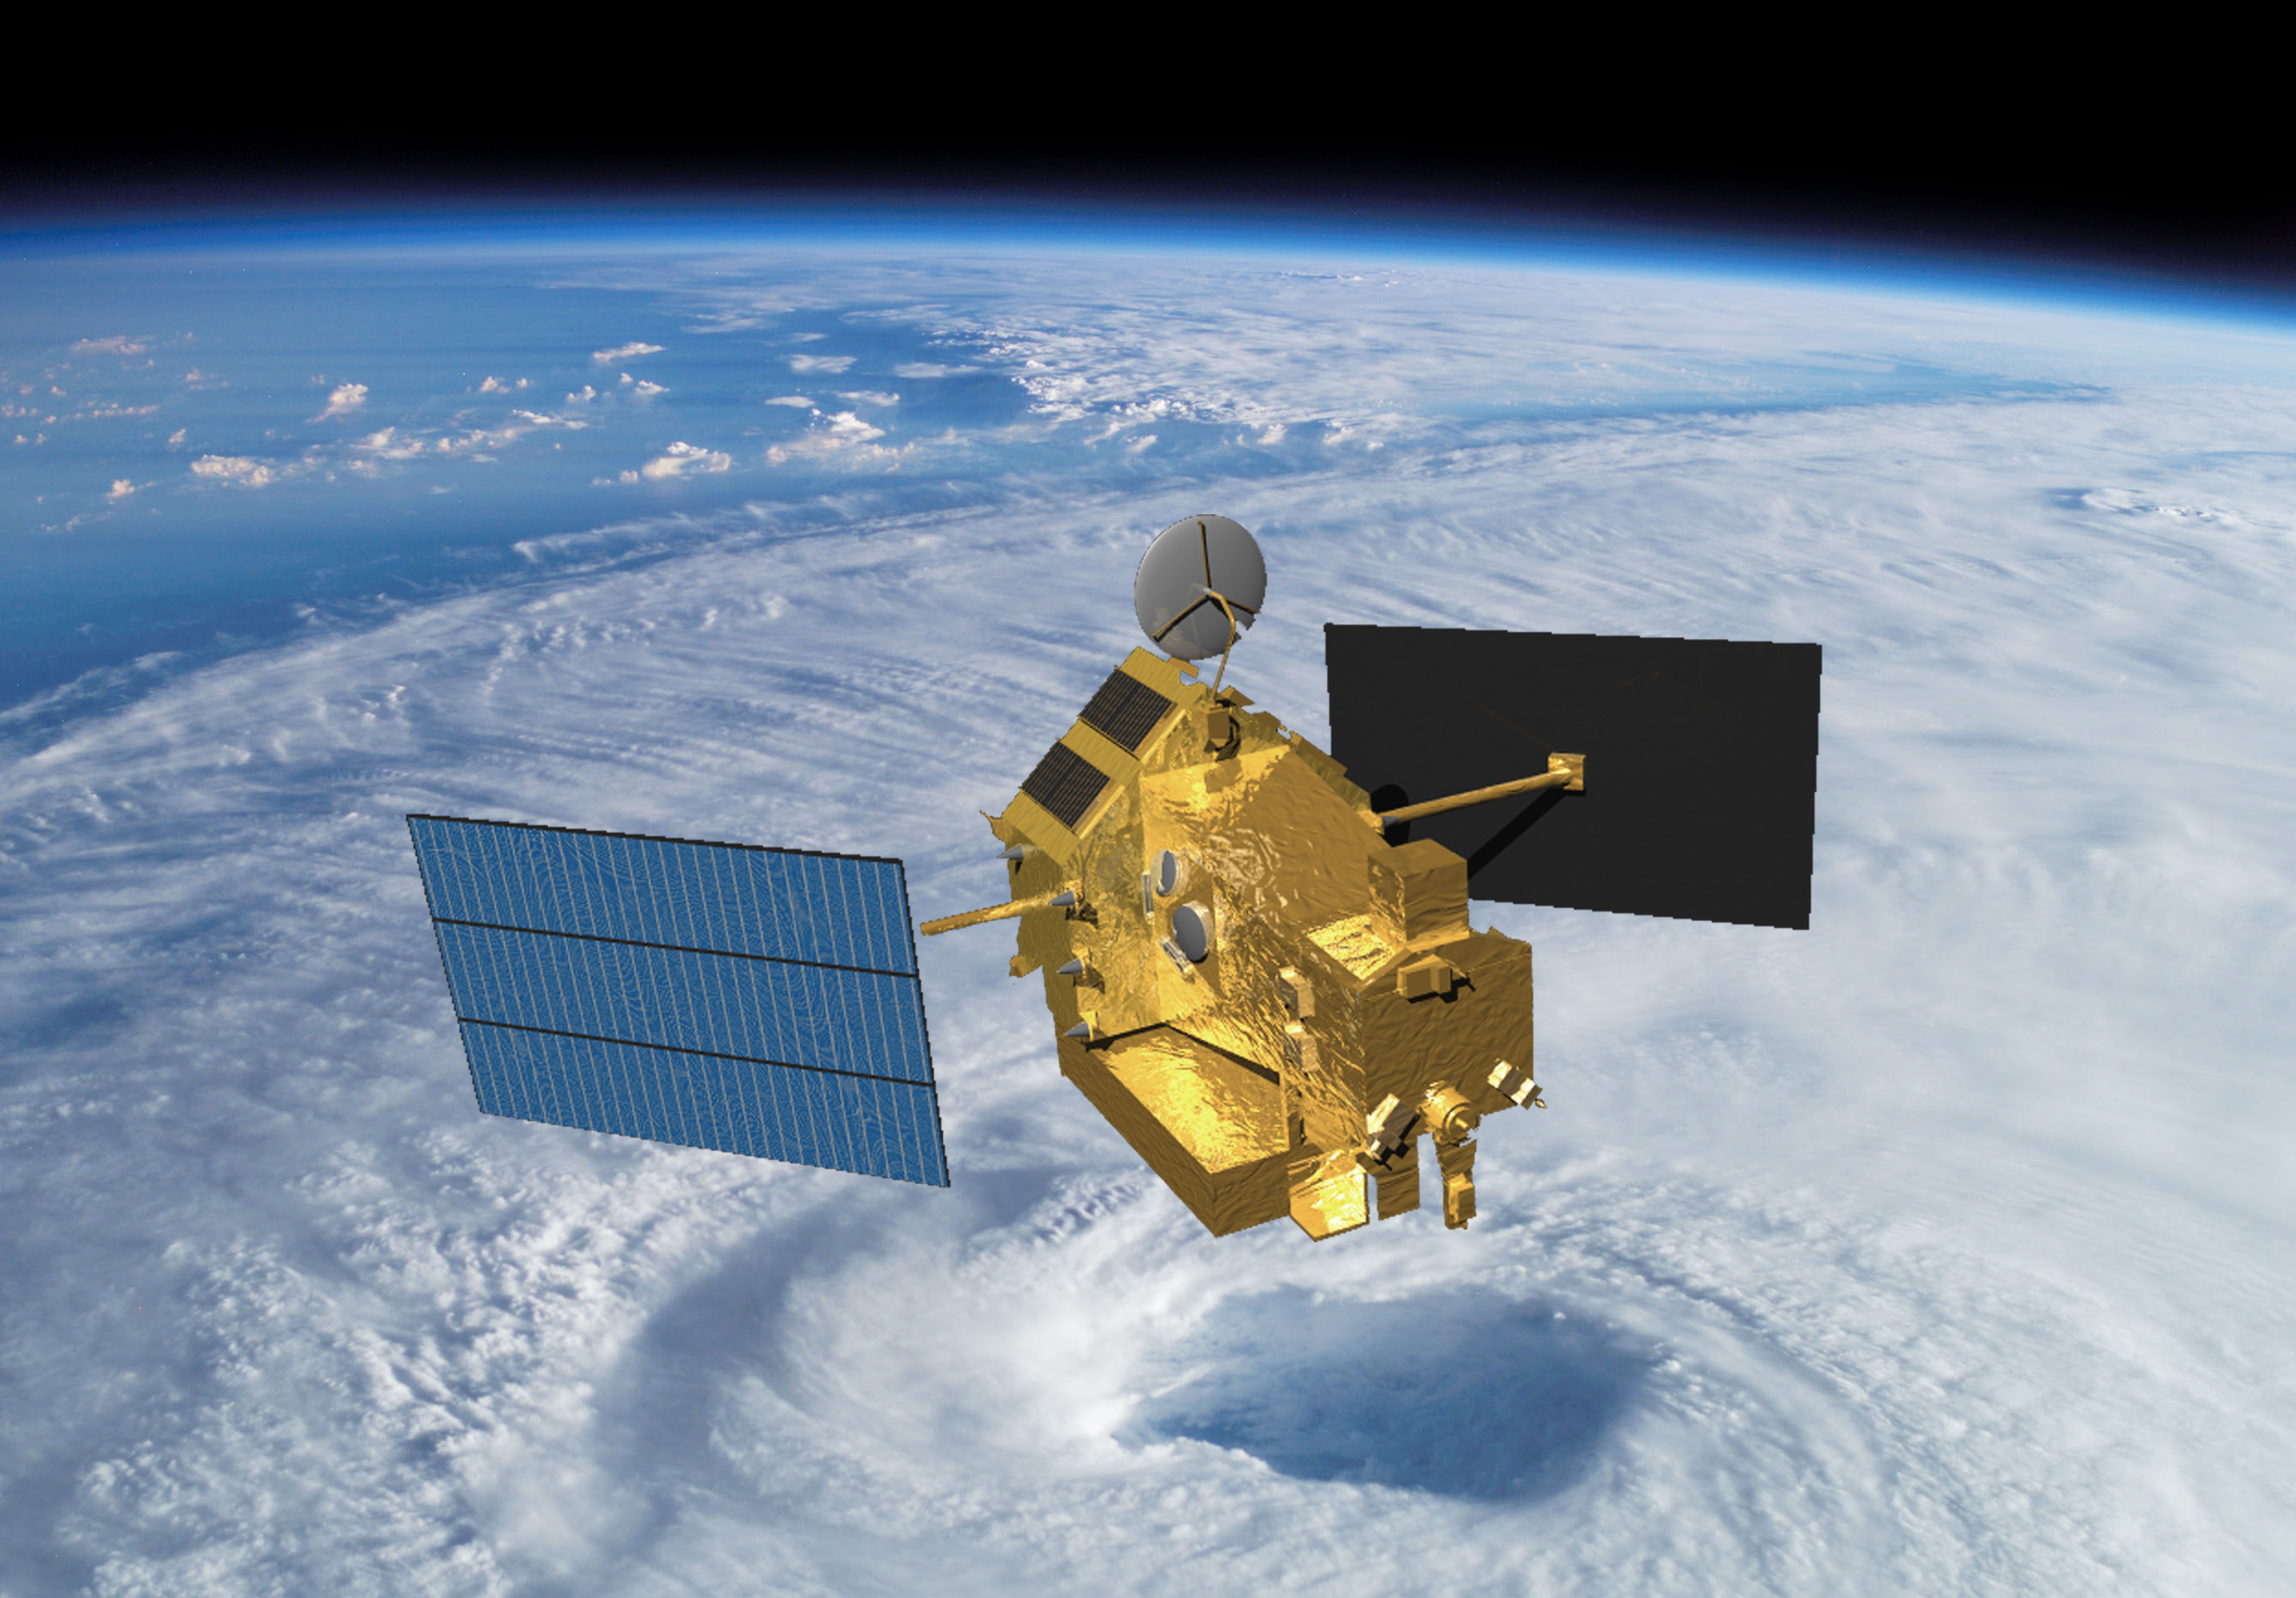
Remote sensing rainfall products: part three: TRMM
TRMM is the third rainfall products I would like to explore in my studies.
TRMM is very useful, at least commonly suggested, particularly in the tropics (45s to 45N). There has been some reports that TRMM rainfall products are bettern that others. Here I am downloading the TRMM data and processing it using R.
As usual, first, we need to attach the necessary packages
library(raster)
## Loading required package: sp
library(ncdf4)
library(rgdal)
## rgdal: version: 0.9-1, (SVN revision 518)
## Geospatial Data Abstraction Library extensions to R successfully loaded
## Loaded GDAL runtime: GDAL 1.9.2, released 2012/10/08
## Path to GDAL shared files: /Library/Frameworks/R.framework/Versions/3.1/Resources/library/rgdal/gdal
## Loaded PROJ.4 runtime: Rel. 4.8.0, 6 March 2012, [PJ_VERSION: 480]
## Path to PROJ.4 shared files: /Library/Frameworks/R.framework/Versions/3.1/Resources/library/rgdal/proj
library(lattice)
library(rasterVis)
## Loading required package: latticeExtra
## Loading required package: RColorBrewer
## Loading required package: hexbin
library(ncdf)
The working directory need to be set
setwd("/~/TRMM/Project/")
I downloaded the dataset set from nasa websites in netcdf, so to process them in r, i need to convert into raster object. The trmmlist is the list object of all my netcdf files in my folder, created using the list.files function.
trmmlist<-list.files(pattern ='.nc', full.names = TRUE)
Then here I need to use multi-layer function from raster package (in this case particulary the rasterstack)
trmm.stack <- stack(trmmlist)
trmm.stack
## class       : RasterStack
## dimensions  : 400, 1440, 576000, 365  (nrow, ncol, ncell, nlayers)
## resolution  : 0.25, 0.25  (x, y)
## extent      : -180, 180, -50, 50  (xmin, xmax, ymin, ymax)
## coord. ref. : +proj=longlat +datum=WGS84 +ellps=WGS84 +towgs84=0,0,0
## names       : precipitation.1, precipitation.2, precipitation.3, precipitation.4, precipitation.5, precipitation.6, precipitation.7, precipitation.8, precipitation.9, precipitation.10, precipitation.11, precipitation.12, precipitation.13, precipitation.14, precipitation.15, ...
The dataset is daily global dataset for 1998, hence I need to crop to my study area, using crop function
extent_UBN <- extent(34,41,7,13)
TRMM_UBN <- crop(trmm.stack, extent_UBN)
TRMM_UBN
## class       : RasterBrick
## dimensions  : 24, 28, 672, 365  (nrow, ncol, ncell, nlayers)
## resolution  : 0.25, 0.25  (x, y)
## extent      : 34, 41, 7, 13  (xmin, xmax, ymin, ymax)
## coord. ref. : +proj=longlat +datum=WGS84 +ellps=WGS84 +towgs84=0,0,0
## data source : in memory
## names       : precipitation.1, precipitation.2, precipitation.3, precipitation.4, precipitation.5, precipitation.6, precipitation.7, precipitation.8, precipitation.9, precipitation.10, precipitation.11, precipitation.12, precipitation.13, precipitation.14, precipitation.15, ...
## min values  :               0,               0,               0,               0,               0,               0,               0,               0,               0,                0,                0,                0,                0,                0,                0, ...
## max values  :      14.6700001,      11.6118994,      40.3315659,      31.6561451,       7.6004300,      12.4990177,      20.3340530,      10.4713869,      11.6363354,       36.1233749,       47.0464554,      111.5707855,      153.4943848,       19.3972626,       14.1478634, ...
If we see here, there is about 365 raster layer, each layers for year days of the year. I would like to see a single rainfall layer. lets say, a layer with maximum mean rainfall, we can do
RF.TRMM<-cellStats(TRMM_UBN ,stat=mean) # rainfall mean over the basin
TRMM_rainyday<-which(RF.TRMM==max(RF.TRMM[1:32000],na.rm=T)) # select max rainfall time steps
Rainyday <-raster(TRMM_UBN ,layer=TRMM_rainyday) # use to single out the rainy time step
Rainyday
## class       : RasterLayer
## dimensions  : 24, 28, 672  (nrow, ncol, ncell)
## resolution  : 0.25, 0.25  (x, y)
## extent      : 34, 41, 7, 13  (xmin, xmax, ymin, ymax)
## coord. ref. : +proj=longlat +datum=WGS84 +ellps=WGS84 +towgs84=0,0,0
## data source : in memory
## names       : precipitation.203
## values      : 0, 99.3935  (min, max)
So now we already selected raster layer with the highest mean rainfall over the UBN basin, i.e 203th day of the year. I would like to overlay the basin shape file on the rainfall raster map. Here is the shape file
 UBNshape<- readOGR(dsn="/Users/administrator/Documents/UBN_20136/Abbay/cell", layer="mask")  # read the shape file using the readOGR function
 ## OGR data source with driver: ESRI Shapefile
 ## Source: "/Users/administrator/Documents/UBN_20136/Abbay/cell", layer: "mask"
 ## with 2 features and 6 fields
 ## Feature type: wkbPolygon with 2 dimensions
 proj4string(UBNshape) # describes data’s current coordinate reference system # to change to correct projection:
 ## [1] "+proj=utm +zone=36 +ellps=clrk80 +towgs84=-165.0,-11.0,206.0,0.0,0.0,0.0,0.0 +units=m +no_defs"
 UBNshape <- spTransform(UBNshape, CRS("+proj=longlat +datum=WGS84"))   #### change to WGS84
Now we can plot both ratser rainfall of the rainy day, and the shapefile of the basin. For that we can use the rasterVis::levelplot for the raster and sp::sp.polygons for the polygon using the following functionalities.
levelplot(Rainyday) + layer(sp.polygons(UBNshape))

To extract a point rainfall data, we can create spatial points and extract the data from the layer using these spatial points. For instance, let me extract for a single location.
ADET<-cbind(37.47,11.27); ADET<-SpatialPoints(ADET)
TRMM_station<-data.frame(
time=seq(as.Date('1998-01-01'), as.Date('1998-12-31'), 'day'),
ADET=as.vector(extract(TRMM_UBN, ADET))
)
The daily time series rainfall at a particular point, ADET station, for the year 1998 is:
xyplot(ADET~time|equal.count(as.numeric(time), 1, overlap = 0.1),
TRMM_station,
type = c("l","g"),  lw=2, strip = FALSE,
xlab="time", ylab="TRMM rainfall",
scales = list(x = list(relation = "sliced", axs = "i"),
              y = list(alternating = FALSE)))